I’ve been doing some UX consulting with dev teams and working on workshops and talks about Front-end performance and accessibility. One of things that comes up is tools. How can we find out about something we could improve (and how do we measure it)?
Here are some things that I’ve shared with people recently to help pull the FED and UX sides a little closer together.
UX tools for (Front-end) developers
The dev teams I talked to wanted something that could fit in with their existing process and not add lots of new “UX debt” tickets. I’ve gathered a bunch of handy UX checklists. The checklists are broad enough that they work as general guidelines, and can used even without personas or journey maps (although we did do these too).
I went through those and picked a handful that seemed to fit the team and the application they work on. As a team, they decided which one they felt most comfortable with. Then we did a mini Mob-like session to rewrite and update the checklist to make it more personal and a slightly better fit.
To pull this in, we agreed that a small “UX check” should be added at appropriate stages in their workflow (early on, with design, and again later, with code review): just one item from the checklist. It felt like a good start.
(Front-end) developer tools for UX peeps
Chrome’s DevTools have a lot in them, but looking at just the Network tab can give you a good, quick, overview of the general performance state of a page. Open DevTools, select the Network tab, then reload the page. At the bottom of the Network tab you’ll see the number of requests (smaller is better), the size of the page (MBs transferred, smaller is better), and how long the page took to Finish loading (quicker is better).
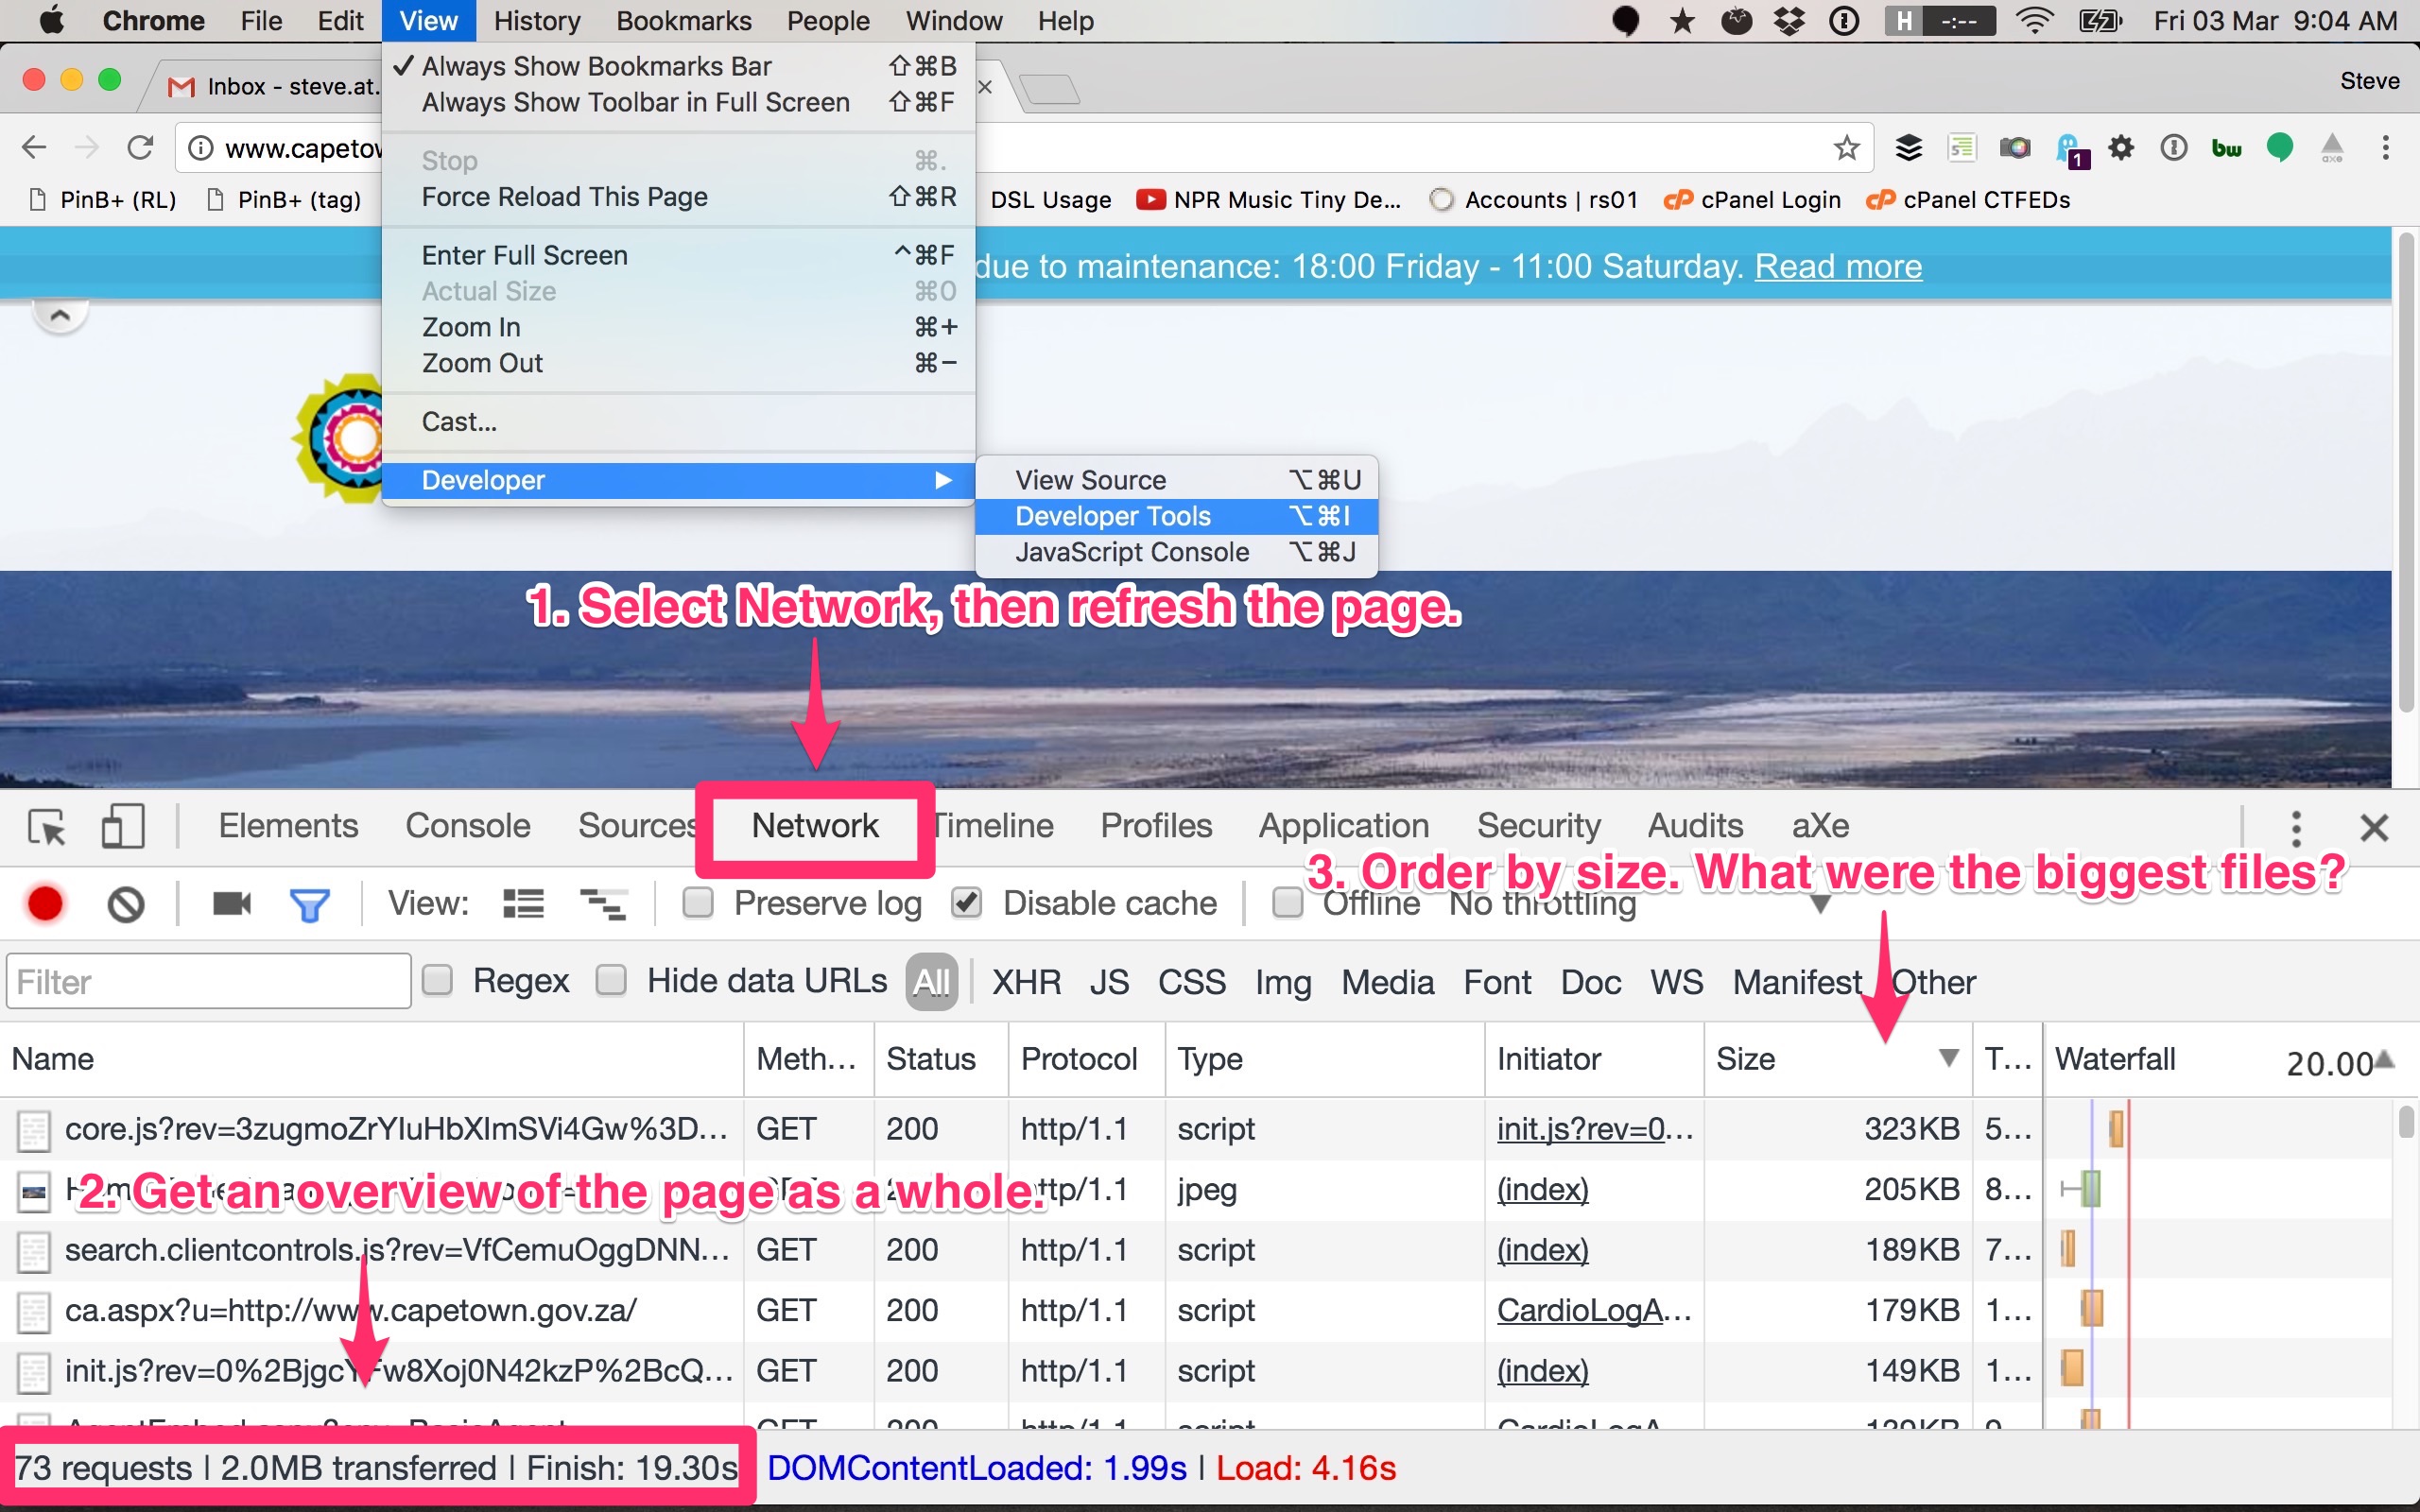
I also like to sort by size to see what the biggest few things where. Was about half the page images? Does that feel like a good balance?
An alternative is to use WebPageTest. It’s not the prettiest of sites, but it gives you a lot of stats and you get a shareable URL. The summary table at the top gives you the the same (requests, size, and loading) stats that you get from DevTools, plus a few more.
For reference, as of February 2017 the average numbers of requests is about 100 and the average page size is 2.5MB, according to httparchive.org. These are quite big!